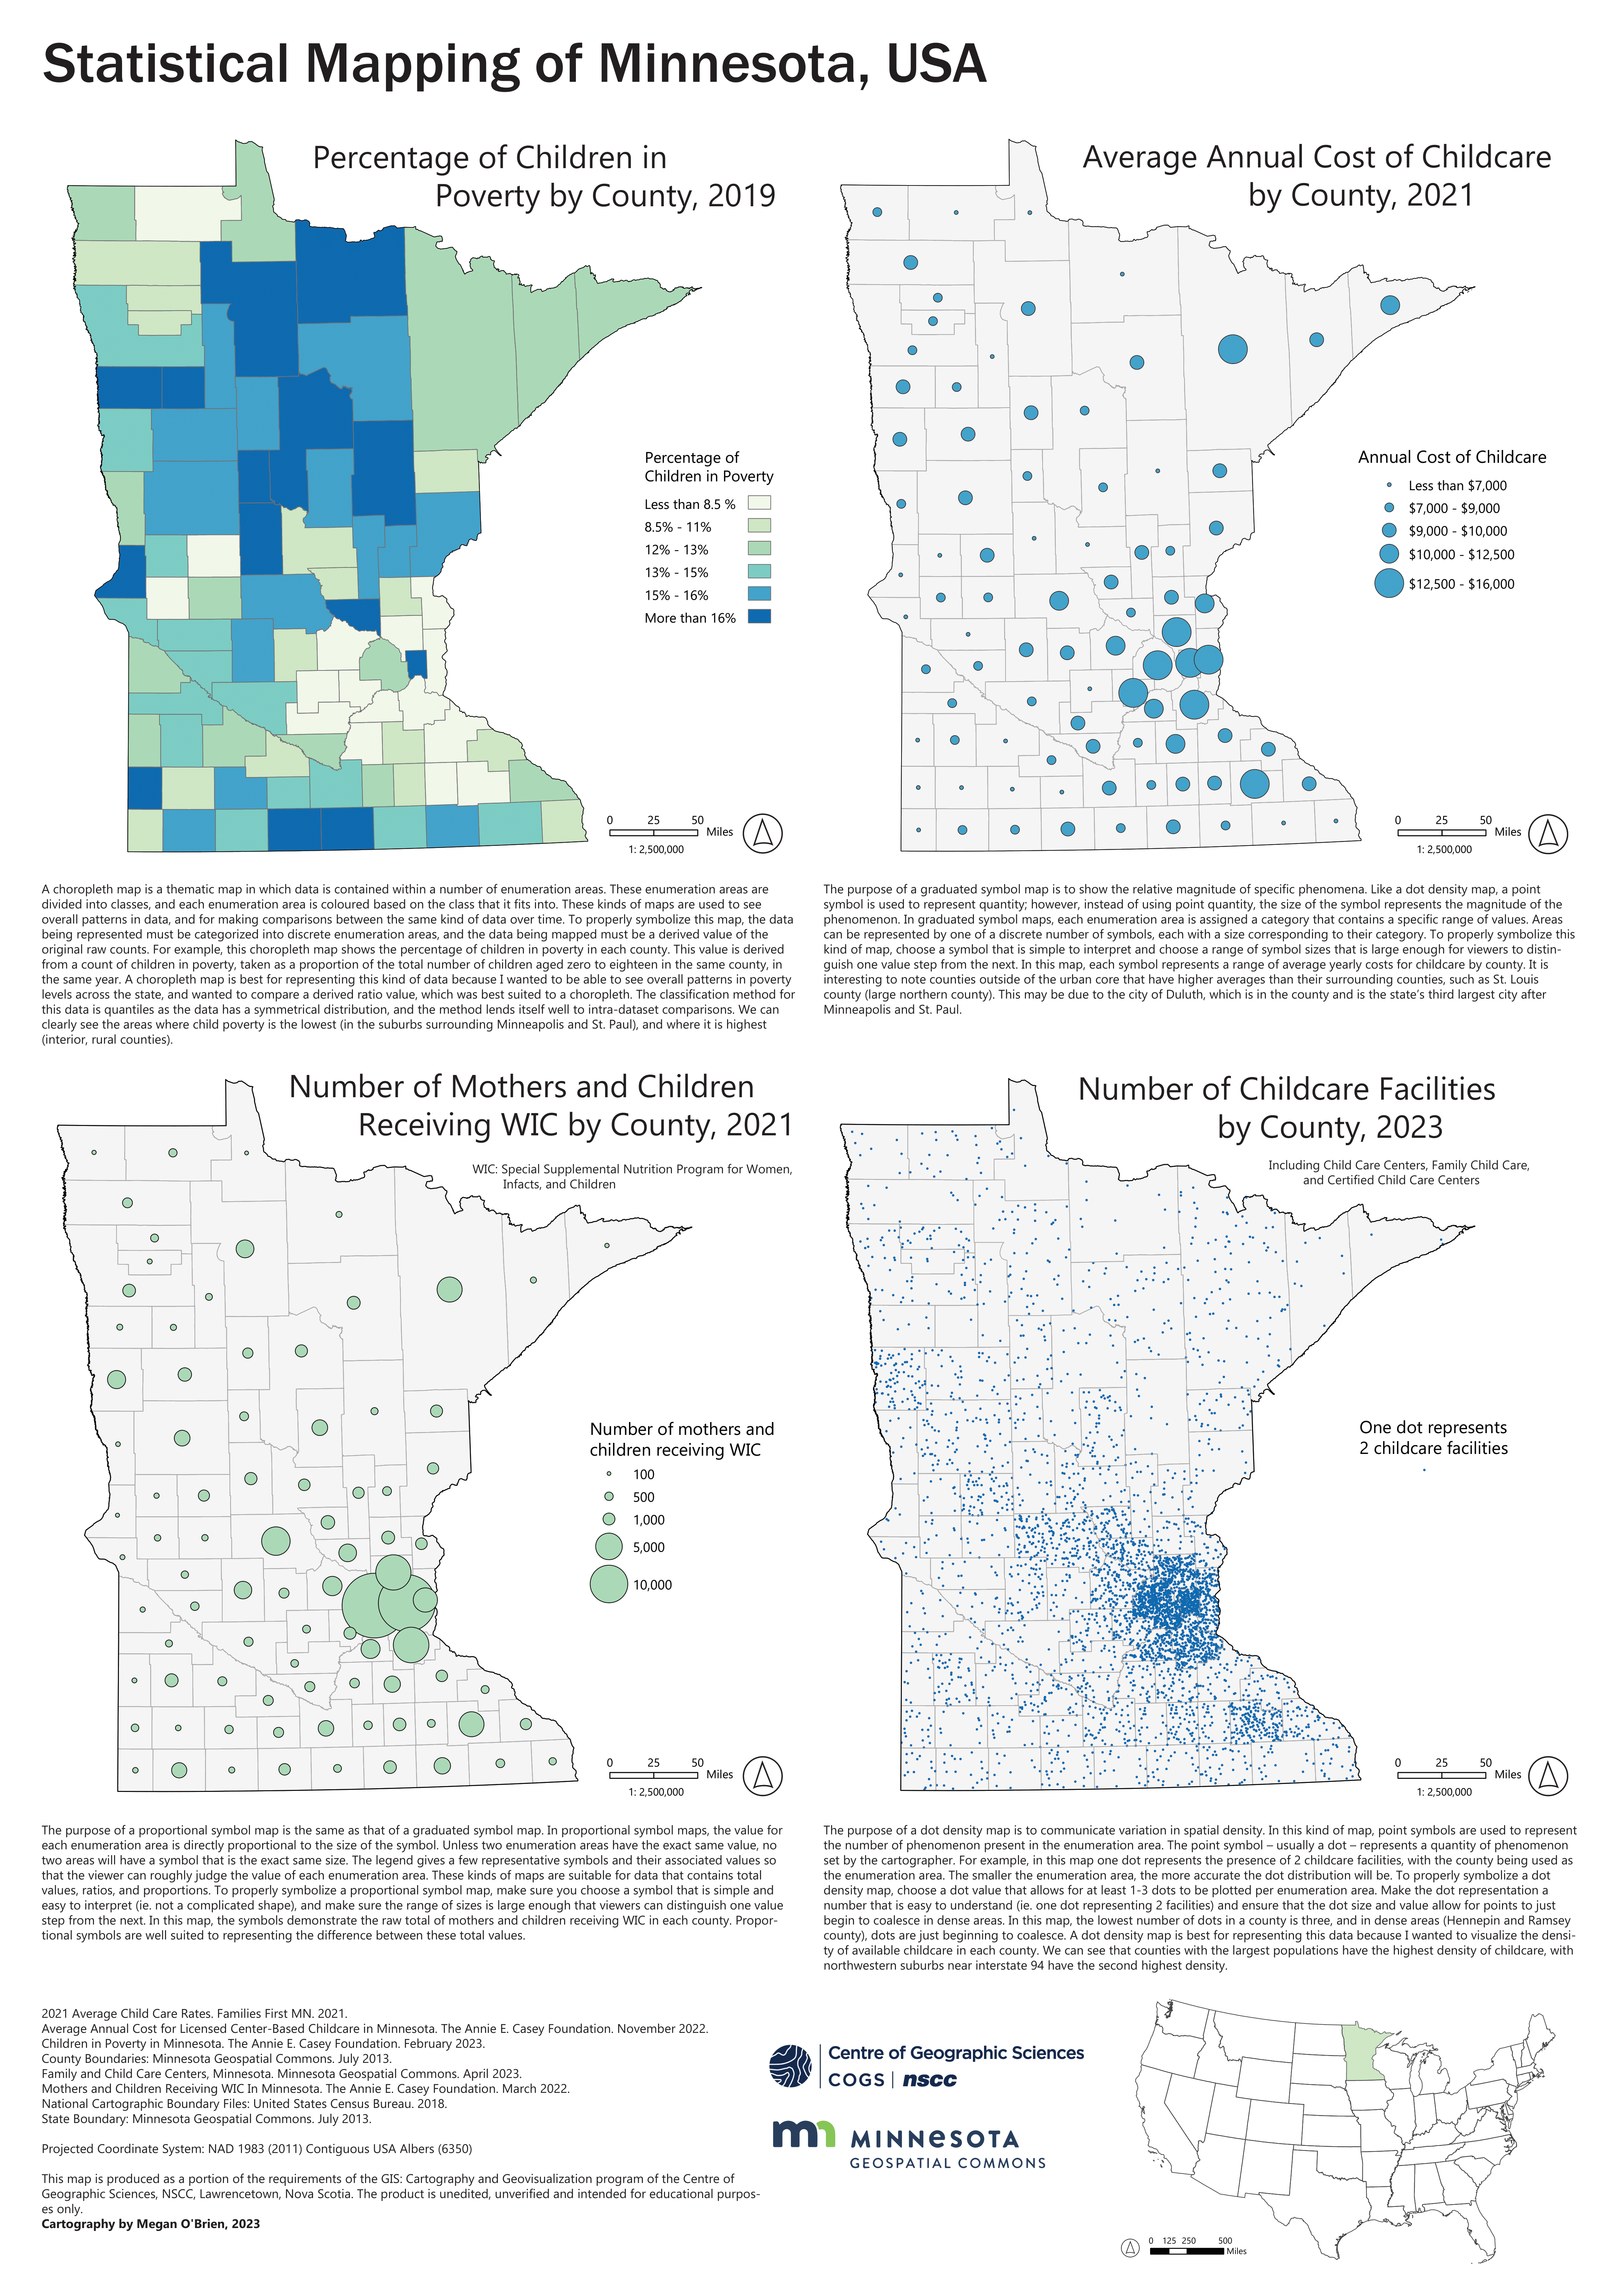
Four statistical mapping techniques are applied to data representing child welfare in Minnesota, USA. Data related to childcare, child poverty, and food supplments are represented using choropleth mapping, graduated symbols, proportional symbols, and density maps. Geoprocessing and data management was performed in ArcGIS Pro, and design was finished in Adobe Illustrator.
- Cleaned state and nation-wide data to focus on indicators of child poverty in MN, 2019 – 2023.
- Showcased statistical mapping techniques including choropleth, graduated symbol, proportional symbol, and dot density maps.
- Highlighted regions of the state with high child poverty, reliance on WIC programs, and average annual cost of
childcare.

Leave a comment